mid year review
Posted on November 08, 2021 in thoughts • 2 min read
At work we have a mid-year business review every October, and this is a pretty stressful time. Prep work for the review starts a month prior and the entire team gets busy with presentations, data and mock sessions.
In the past I had realized that October impacts my personal life a lot, so this time around I cruched up some data to find out the depth of the impact.
Let me walk you thru the data ...
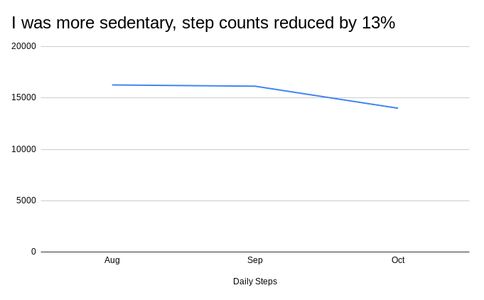
Chart 1 - A measure of activity

Data Source- Fitness Tracker
Inference - I was sedentary by more that 13% in October 2021, as compared against the last 2 months my step counts have reduced by 13%. I was clocking 16k steps a day which was reduced to ~14k steps.
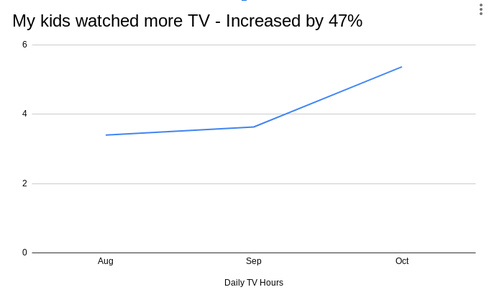
Chart 2 - A measure of family time

Data Source - TV usage monitoring app on a modern day smart TV
Inference - Some context, me and my wife are both working and we are also raising 2 boys (age 7 & 2). Since we both were mostly working, their TV hours increased by about 47%.
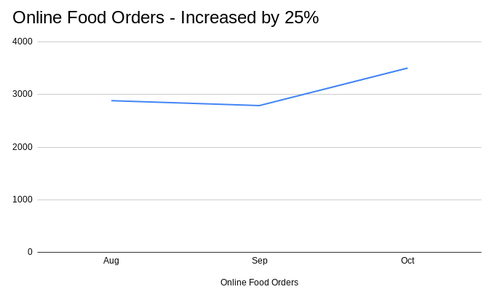
Chart 3 - A measure of family responsibilities

Data Source Order details from apps like Zomato and Swiggy
Inference - Again the same context as before, part of family responsibilities is to cook a meal. This month we had rely more on online food orders, as we could not take out time to cook. Online food orders have increased by about 47%.
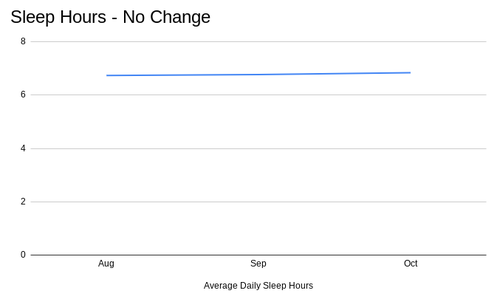
Chart 4 - A measure of rest

Data Source - Fitness Tracker
Inference - This is one area where I did not lose out much, I should say
I have not lost my sleep over the mid-year review !!!
Finally why this post?
The intent here is not to show how busy I was or how I prioritized my work over family. I want to highlight "how can we use data to effectively understand our lives". With gadgets becoming an integral part of our lives it is very easy to relate to the data these gadgets share with us, understand it and reflect on our daily lives.